Cloudiness vs Latitude
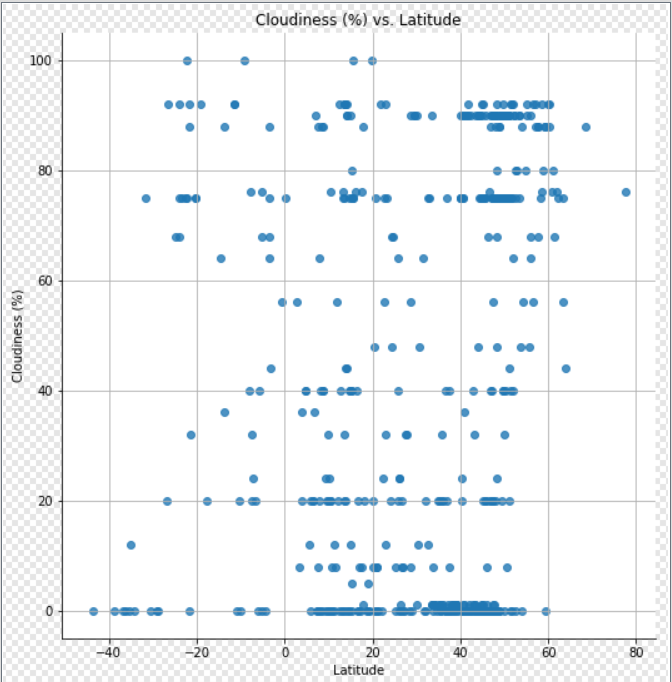
For the cloudiness vs latitude, there are clumps of 0% and 95% but no clear correlation to the latitude.

I decided to create a bubble plot for lat vs longitde with the cloudiness being the size. From here there is a clearer correlation of cloudiness size and % with a large cluster of cloudiness from 0 to 50 longitude and 40 to 60 latitude. This trend can also be seen at -50 to -100 longitude.

